What if we could instantly map the accounting data of any small business to a standard chart of accounts?
Summary ?
- Codat has launched Account Categorization – a feature that maps accounting information to a standard chart of accounts.
- In the absence of one standard chart of accounts, features are blocked for a wide range of products.
- Likewise, any business providing financial services to SMBs is forced to do a lot of time-consuming and error-prone manual data processing, such as financial statement spreading.
- Account Categorization uses machine learning techniques to solve this genuinely complicated problem at scale and massively expands the scope of what the financial technology world can build.
Context ?
Codat standardizes business data APIs. Some of the most complex are accounting APIs. This is unsurprising. Accounting is complicated. Four-year degrees in Accounting exist for good reason. Something as seemingly innocuous as a gift card can create a lengthy scholarly debate.
As Codat maps accounting APIs to a standard data model, our clients don’t need to worry about a litany of little differences like Xero’s API representing Bills as a type of Invoice while QuickBooks Online’s API treats them as separate entities. This drastically reduces the complexity of building and maintaining accounting integrations.
While this standardization across accounting platforms is extremely powerful and saves developers and finance professionals a lot of time, there is a deeper level to accounting data that poses a different challenge.
The problem ❌
There are hundreds of millions of SMBs in the world. They all do their accounts in their own bespoke way. Not only will a high-growth SaaS business have a very different set of financial statements to a century-old vineyard, but even similar businesses may report certain accounts in subtly different ways.
This situation is fine for small businesses themselves. Where it creates problems is for those who provide SMBs with software and financial services. For example, here are excerpts from the financials of three fictional businesses. You need to know how much they spend on advertising.
Company A
| Expenses | |||
| Sep 2021 | Aug 2021 | Jul 2021 | |
| Advertising & Marketing | 2,083.33 | 6,628.13 | 0.00 |
| Light, Power, and Heating | 103.42 | 103.42 | 129.38 |
| Motor Vehicle Expense | 342.79 | 123.75 | 123.75 |
| Postage, Freight, and Courier | 94.19 | 0.00 | 0.00 |
| Printing & Stationery | 65.58 | 0.00 | 0.00 |
| Total Expenses | 2,689.31 | 6,855.30 | 253.13 |
Company B
| Expenses | |||
| Sep 2021 | Aug 2021 | Jul 2021 | |
| Commissions & fees | 907.12 | 812.40 | 875.80 |
| 1200.96 | 975.13 | 123.45 | |
| Disposal fees | 0.00 | 0.00 | 400.00 |
| Dues and subscriptions | 12.18 | 12.18 | 12.18 |
| Equipment rental | 44.40 | 82.20 | 99.45 |
| Total Expenses | 2164.66 | 1881.91 | 1510.88 |
Company C
| Expenses | |||
| Sep 2021 | Aug 2021 | Jul 2021 | |
| Amortisation and depreciation | 33.30 | 0.00 | 0.00 |
| Rent or lease payments | 1250.00 | 0.00 | 0.00 |
| Shipping and delivery | 199.77 | 66.59 | 0.00 |
| Insurance – general | 193.99 | 0.00 | 0.00 |
| Total Expenses | 1677.06 | 66.59 | 0.00 |
It is pretty straightforward to spot the relevant accounts. Company A reports “Advertising & Marketing” expenses. Company B appears to buy ads only on Facebook, so they report “Facebook” expenses. Company C does not seem to spend any money on advertising whatsoever. Maybe they just have great word-of-mouth.
While you or I can do that, a computer program has a very hard time. Accounts are reported by human beings in terms that make sense to them and, usually, other human beings. A person can see that someone has entered “Facebook” under Expenses and understand that this almost definitely means advertising spend. A machine does not know that. But what if there was some way for the machine to learn?
A job for machine learning ?
We needed to define a single, standard chart of accounts that could represent the accounts of every small business globally regardless of their accounting method, size, or industry. This chart of accounts also had to be detailed enough to satisfy the requirements of any and every financial service or software provider that may interact with a small business throughout its lifetime.
Once we had solved this little problem, we would need a model that could take any business’s bespoke chart of accounts and accurately map every single account to our single standard, with a 100% success rate.
We knew this would require a few things:
1. Lots of data
We’ve got a model to train. We estimated we would need at least 10,000 sets of SMB accounting data from different companies in different sectors using different accounting platforms to have anything like a useful sample. Codat, by the nature of our business, is uniquely placed to process such a sample.
2. A deep understanding of accounting data
To help our model out, we needed to give it the best possible starting point. This meant identifying as many as possible of the subtle differences in accounting data that are vitally important but easy to miss.
3. A detailed understanding of possible use cases
We consulted with lots of different businesses who were interested in doing lots of different things with Account Categorization, from alternative finance providers to forecasting and planning SaaS.
4. A strong grasp of data science and relevant machine-learning techniques
We knew a truly universal Account Categorization model would not be an easy thing to build. We put together a great team and hired some new developers with specific knowledge of the problem.
Defining a single chart of accounts ?
To start, we looked at the default categories offered by two leading cloud accounting platforms – Quickbooks Online and Xero.
Quickbooks Online’s default chart of accounts contains 280 possible categories. Users must enter accounts with detailed categorization (e.g., if entering an Expense, they must declare what type of Expense the account is, such as “Equipment Rental” or “Automobile – Fuel.”
Xero’s default chart of accounts has far fewer categories at only 22. In Xero, unlike QuickBooks Online, accounts can be left uncategorized beyond the most general level of “Expenses,” “Income,” “Assets,” or similar.
While the default chart of accounts are different enough already, they are configurable. This is great for QuickBooks and Xero users because they can create, delete, edit, and merge categories to suit their particular needs. For our purposes, we needed a rough idea of how often they do this. Just how different is each user’s chart of accounts?
As it happens, very different. We analyzed the chart of accounts from over 10,000 businesses across QuickBooks Online and Xero, spanning a wide range of sectors and geographies. Out of 300,000 accounts in Xero, we found that only 4% of accounts used the default categories.
For 96% of accounts in Xero, users change the default name or create a completely new, bespoke account name.
For 96% of accounts in Xero, users change the default name or create a completely new, bespoke account name.
After analyzing a range of businesses across sectors and diving deep into different accounting methods (such as UK and US GAAP), we built an MVP with 68 categories. Eventually, after testing in beta, we settled on a single, standard chart of accounts that includes +250 account categories. These 162 strike the right balance between detail and ease of use across a wide range of possible applications.
Now, we just needed to find a way to map instantly and accurately any accounting to our standard model. Easy right?
Designing and building the model ?
The current build of Account Categorization has three elements:
- Mapping defaults
- Natural language processing
- User control
Mapping defaults
This is a nice, straightforward first step. Although accounts don’t usually conform to default categorization, in the 4% of cases (in Xero at least) where they do, we can simply define how they should map to our single chart of accounts. Now for the other 96%.
Natural language processing
Where we need to categorize an account with a name we have not already mapped to our model, we use natural language processing. This is crucial because we could never pre-empt every single name that someone might give an account.
First, Account Categorization removes stopwords (“the,” “is,” “at” and so on) and non-alphanumeric characters. Then, it lemmatizes the account name and description. This means it groups words that are closely related as forms of each other or synonyms. In a simple example, this might mean Account Categorization could take two different Cost of Sales Accounts, such as “freighting costs-of-sale” and “freight cost,” and understand them as the same thing.
Account Categorization then evaluates this output using text distance metrics. If the difference between the output and our chart of accounts is below a certain threshold, Account Categorization can confidently suggest a mapping for the account.
User control
Ultimately, Codat’s user stays in control of how accounts are categorized. Everywhere our model can suggest a category, it does. Where it is not sufficiently confident, it makes no suggestion. Everything can be recategorized by a user after the model has run. For our users, this provides the flexibility and control they need. For us, it helps the model learn faster as if it were crowdsourcing the training process.
For similar reasons, Account Categorization has a PATCH endpoint in our API (it partially updates a record), not a PUT (edits the whole thing). Account Categorization isn’t arrogant about how well it understands data. It never overwrites anything. It just adds useful new information. Our users never lose access to information that could supply necessary context.
To illustrate, here is the format the data takes when Account Categorization returns results.
{
  "results": [
    {
      "accountRef": {
        "id": "string",
        "name": "string"
      },
      "suggested": {
        "type": "string",
        "subtype": "string",
        "detailType": "string"
      },
      "confirmed": {
        "type": "string",
        "subtype": "string",
        "detailType": "string"
      }
    }
  ]
}
There are three main objects:
- accountRef: this is the account as it appears in the SMB’s accounting platform. This information is never lost.
- suggested: This is our model’s suggestion.
- confirmed: This is filled in by Codat’s user, either when the user accepts the suggestion or when Codat’s user recategorizes the account themselves. Every time someone does the latter, Account Categorization learns. It won’t make the same mistake again.
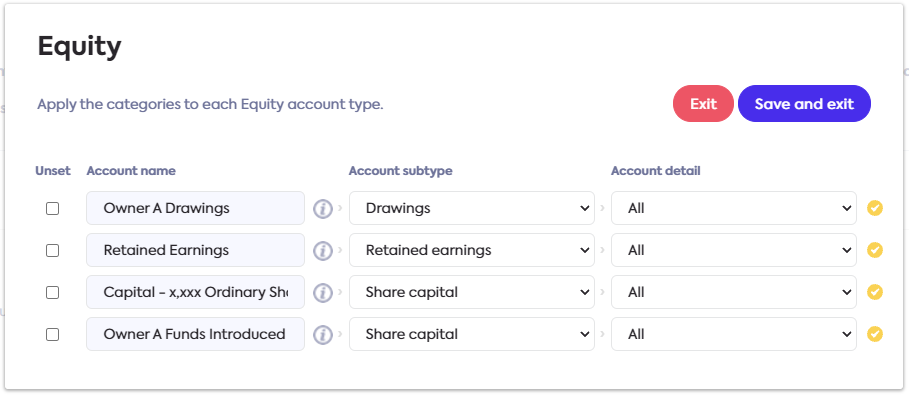
Users can also go through this process without ever seeing a line of code. A “Categorize Accounts” button is available for every linked company visible in Codat. Users can accept or modify Account Categorization’ suggestions.
For example, here is what it looks like when a user modifies the categorization of different Equity accounts.
Conclusion ✨
Account Categorization uses machine learning techniques to solve a genuinely complicated problem at scale. With a new level of normalization in the accounting information accessible via Codat, banks and fintechs are building great things.
With Account Categorization, teams can build high-value features for the whole market without worrying about the subtle differences among their customers’ accounts.

Eimear Donnelly, Senior Product Manager – Data
