Not long ago, we launched Categories, a feature that uses AI and machine learning techniques to instantly map accounting information to a standard chart of accounts.
As no public datasets or models exist that have the same functionality to the same level of maturity, we’re often asked, ‘how exactly does it work?’ and ‘how did you implement it? ’. This article pulls back the curtain on our Categories feature to explain exactly what goes on behind the scenes. We provide an overview of the entire pipeline, from data ingestion right the way through to returning a valuable result to the client, and even outline the problem boundaries, the logic behind our decisions, and what we’re working on next.
Intrigued? We thought you might be.
Every SMB is different
SMBs need to relate their transactions to a relevant financial account in their accounting software. But, every business handles this process differently. For example, one SMB purchasing targeted ads on Google may mark the transaction as coming out of their ‘Marketing’ budget. Another may attribute the spend to ‘Advertising’. When it comes to ingesting data from a many SMBs, inconsistencies like this can create real challenges. Identifying the subtle differences between business accounts is incredibly time-consuming, resource-intensive, and error-prone. Categories solves this problem for you.
What problem are we solving?
Essentially, the problem we solve can be split into two main areas.
1. By standardizing and predicting categories, we allow for much easier comparisons between SMB accounts. We simplify and normalize the machine comparison between the two businesses by funneling these into a common category (e.g. SalesMarketing account).
2. This significantly reduces the manual toil associated with correctly categorizing the accounts manually, requiring specialist accounting knowledge.
How does it work?
Maturing this feature has been an interactive process. Much of the initial value was added without clustering or classification models. With this in mind, we have a balanced prediction architecture that started mainly as a rule-based heuristic system. This has subsequently progressed into using some NLP and will continue life with more weighting on a custom modeling solution in the future.
The model considers three components of the category:
- Type – the highest level classification of an account, (e.g., asset, liability, etc).
- SubType – a secondary classification used for traditional financial ratios such as current assets and current liabilities.
- DetailType – individual accounts such as cash, inventory, and depreciation.
We treat these three components as highly hierarchical: Type -> SubType -> DetailType.
That is to say, type restricts what subtype options are allowed, and similarly again with detailtype.
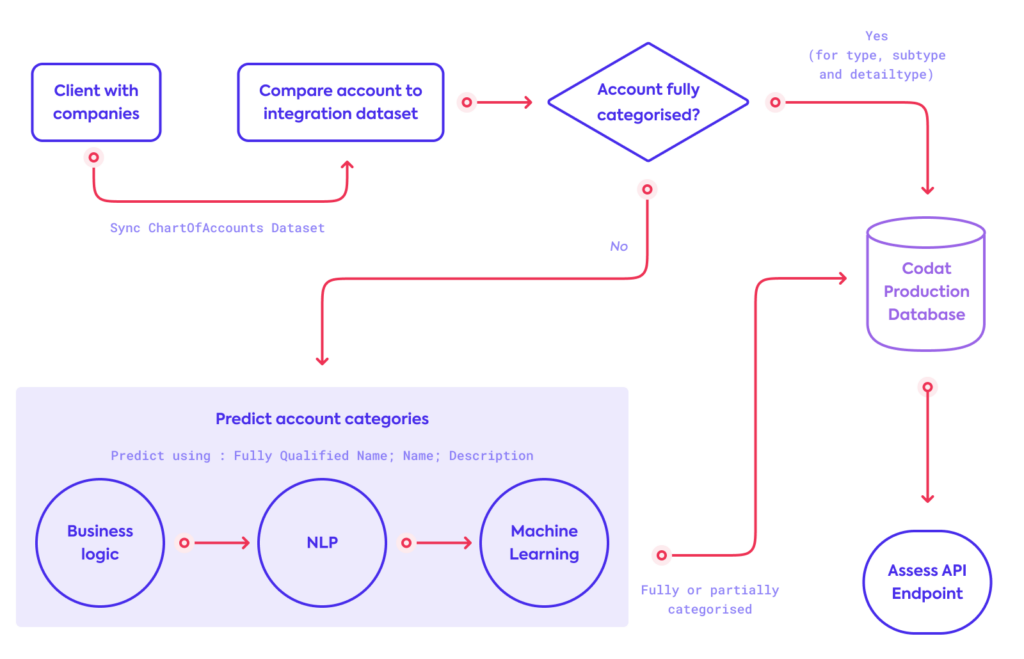
We maintain a list of known and fixed categories from various accounting software that we call the Integration Dataset. Before any predictions are considered, uncategorized accounts are first compared against this Integration Dataset of known categories from accounting platforms which might give a direct map to a standard Codat category.
If an incoming account matches an entry in our dataset which matches the source accounting platform, we can skip the predictive step and categorize it directly with 100% confidence. If the dataset entry’s source accounting platform does not match the source of the incoming account, we use this dataset entry as a feature when running through prediction steps.
This dataset is unique and is a byproduct of Codat being uniquely placed at the intersection of many different accounting platforms.
Predictions are then made by leveraging in-house domain expertise combined with NLP. The latter takes the form of an internal dataset, with each row providing keywords and phrases – our Corpus – to use as training data to identify individual account categories.
The Corpus is modified on deployment to contain Inverse Document Frequency values (as in, the second half of TF-IDF) to numerically represent the importance of an individual word or phrase when compared to the whole Corpus. We exclude the Term Frequency (TF) as we assume the terms only appear once per Document.
NLP techniques (string cleaning, regex, tokenizing, removing stopwords, lemmatization, n-grams, etc.) are applied as part of an ingestion pipeline to parse in text data about the incoming account for comparison to our Corpus.
Main pipeline predictions
Predictions are then assigned within a pipeline. Each step in the pipeline can produce a percentage confidence, which will overwrite the previous one if better. We also note that, at any given categorization stage, a partial categorization might only be performed leaving any future steps to fill in the blanks.
1. We restrict invalid categories
Essentially, we dynamically restrict our ‘training’ data (Corpus), and this can happen in two ways. Firstly, we restrict the Corpus if we have partial suggestions from our Integration Dataset. For example, if it has predicted only type = Asset, we will only consider combinations containing that type, before running our secondary restriction step over the remaining components to restrict further potential categories.
Secondly, our Corpus contains keywords that allow us to rule out certain combinations of accounts. For example, the word “Fees” should not appear in an account being mapped to Asset.Current.Cash. To do this, we use the textdistance package to overlap the data from the incoming account against our Corpus of “exclude” words. Textdistance handily returns a score normalized between [0,1] (where 1 represents the highest similarity using the Szymkiewicz–Simpson Coefficient), and we compare the scored rows against a threshold to decide on dropping that potential category, thus removing available prediction options for later steps.
2. We compare each categorical component directly against known mappings
While the data being considered has already been compared against our Integration Dataset (which lets us try and reuse categorizing logic directly from the account platforms), in this stage, we simply try to look up our Categories model and find direct matches of type, then subtype, then detailtype.
We also wiggle our starting position in the hierarchy, as in some cases we might find that starting at SubType and then essentially back-propagating this prediction to type and subtype gives a better result.
3. We use text overlaps with IDF scores
The account name and description has good predictive power when compared against the Corpus in several ways. Each name and description is compared against our Corpus and several weighted scores (one of these being the Jaccard similarity) are returned for each row. These weighted scores are then compared against a probability distribution of prior values, generated by sampling the database for a representative sample, and the percentile of the score is returned thus weighting each score by its probability of occurrence, allowing for an apples-to-apples comparison between different row scores.
4. We compare subtype overlaps with the Corpus
A recent addition to the model, this aims to treat the subtype individually as a predictor and calculates overlaps in a similar way to the restrict invalid categories step. Often, we have a model of Type 1->* Subtype 1->* DetailType. By starting ‘in the middle’, we can sometimes backpropagate a more suitable type, thus giving a better prediction than when we initially dynamically restricted our training set.
For simplicity’s sake, I haven’t mentioned a few other minor steps which can essentially be bucketed into the 4 steps above, just with slight differences in application order.

The challenges
Some of the key challenges we encounter include:
1. There are no existing labels to confirm accuracy of predictions
Our initial predictions were manually verified, but much higher weight was given to existing, known mappings from our Integration Dataset. As such, the data science predictions were only used when we had extremely high confidence, thus lowering our overall prediction rate.
The labels for this data are not easily come by either, as professional accounting experience is required to accurately categorize accounts. Moving forward, we are prompting clients to confirm our predicted categories (essentially crowdsourcing our labeling to the experts). When we have enough data, this will allow us to switch over to a supervised modeling approach. It also means that all of our predictions will improve each time someone confirms any individual prediction.
2. Evaluating time saved quantitatively by our clients
We know this feature saves our clients (and their linked companies) considerable time, but it can be hard to pin an exact figure to this piece. This is because it actually positively impacts many different processes for our clients.
For example, a traditional loan application will require a business to ask their accountant to send their financials to a bank (using PDFs, etc). The bank might then spend up to 30 days manually parsing the financial information out into their own internal custom categories, before an account manager performs additional calculations and reaches a decision. This process then happens at a regular cadence for ongoing risk assessment. So, we can be confident that we are definitely saving time, but it is not easy to pin down an exact number – each relationship can be complex and different!
3. Mixing business logic with modeling
Although this problem is dimensionality-confined (e.g. there exists a finite number of possible categories and incoming account combinations), there are still a number of specific edge cases that have to be handled in lieu of having a mature ML-based solution deployed. This continues to be a challenge, even as we transition, due to the popularity of the feature and the feedback from specific clients who want to help us improve the feature. We love feedback, please let us know if we can improve specific predictions!
Future improvements to predictions
The team has deployed an accurate Random Forest classification model and we’re currently testing the model predictions alongside the existing architecture. The problem space has well-constrained dimensions since there are a fixed number of accounts, hence we should be able to avoid the curse of dimensionality and things like dimensionality reduction using PCA, etc.
Model tracking capabilities are being built out using tools such as MLFlow to track model success metrics, and other things like Data Drift. We aim to phase out the business logic in favor of modeling, as this is a clear example of a problem space which will eventually be too complex to solve heuristically in a reasonable manner. As a byproduct, whenever we transition fully to our model, it will reduce the complexity of our internal codebase.
Key takeaways
- This is a unique, novel problem and hence an exciting one! No public datasets or models exist that have this functionality to the same level of maturity.
- Categorizing accounts is a hugely important feature with a wide-reaching impact. Our clients spend less time parsing and mapping data, with the added benefit of being able to easily compare SMBs across more granular cohorts, giving them more time to tailor financial products to SMBs. In turn, this benefits SMBs who get access to more financial products with quicker decision times.
- In some ways, the problem seems easy from the surface. We have a clear classification problem within a well-defined problem space. However, the catch-22 of this is the labels. There are no pre-existing labels for this problem, so other solutions have been found to overcome this.
- A huge amount of time and domain expertise has built up a competent and accurate classification process using a variety of business logic and NLP ML techniques.
- Our prediction rate is >90% across all 3 categorical components, and we have analysed over 90,000 companies to date.
- We are actively ramping up our ML capabilities, and the more our clients confirm our categories, the better the predictions will become.

Ronan Diver, Data Scientist